
Golang pprof
Hi Guys, In this blog we will see a tool available in golang(It has been there for very long time and also available for some other languages as well like c, c++ etc) called pprof. This basically allows you to monitor how much time spent within each function and then drill down on those calls till OS level syscall. You can use these pprof dump(its also available through web API when integrated with library) and create some reports or look into top functions which are taking most of time and also use some tools to visualize these pprof file.
You need to have program running for some time, otherwise pprof will not able to collect the samples.
So Lets gets started with very first and very simple.
package main

import (
	"flag"
	"fmt"
	"log"
	"os"
	"runtime/pprof"
)

var cpuprofile = flag.String("cpuprofile", "", "write cpu profile to file")

func main() {
	flag.Parse()
	if *cpuprofile != "" {
		f, err := os.Create(*cpuprofile)
		if err != nil {
			log.Fatal(err)
		}
		pprof.StartCPUProfile(f)
		defer pprof.StopCPUProfile()
	}
	for i := 0; i < 10000; i++ {
		DoSomeWork(i)
	}
}

func DoSomeWork(jobId int) {
	fmt.Printf("Working on : %d", jobId)
	fmt.Printf("Completed : %d", jobId)
}
this program accepts cpuprofile parameter from command line(using flags library), which will the file name for our pprof output file.
Now lets run above program and generate pprof data.
go run . --cpuprofile=profile.pprofthis command will generate new file in our project named profile.pprof and now lets use go tool to get some details out of it.
go tool pprof profile.pprofthis should give output something like(your numbers may vary).
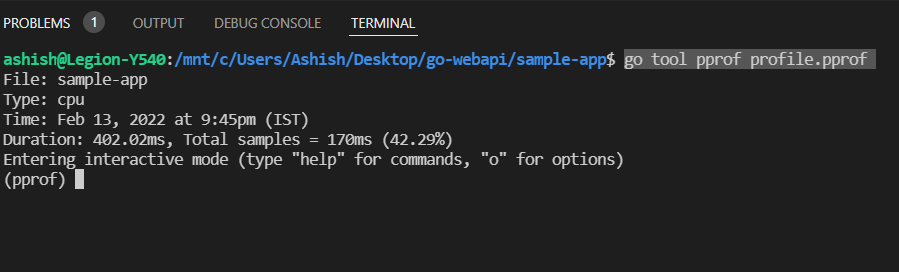
As you can see, you will get console for pprof, like we used to get nodejs 🙂 . Here you can run some awesome pprof commands to get the result.
First lets analyize what we have got here, Duration: 402.02ms, Total samples = 170ms (42.29%) here its shows that it took 402.02 ms to run our program and out of which 170ms of sample has been collected.
Next lets see top 10 function where our program spent time.
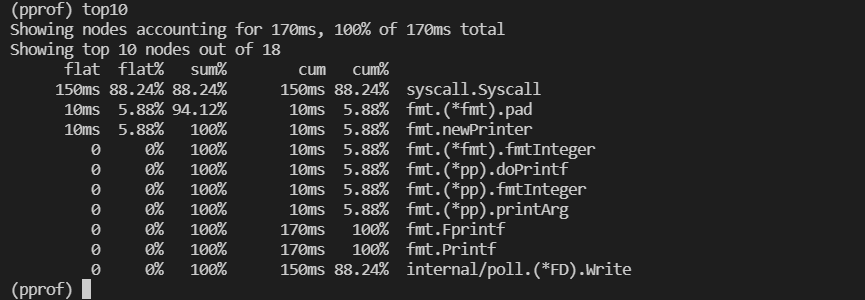
As you can see from above screenshot the most of our time was spent in syscall and fmt (as thats the only function used in our example).
This is very powerful and will definitely help you to debug and find bottleneck in your application.
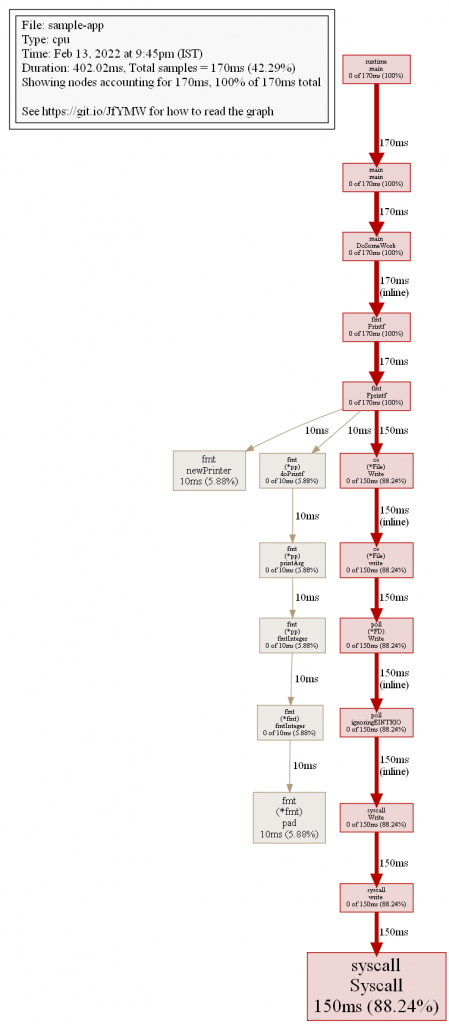
we can also visualize above pprof file with web pprof command(type web in pprof terminal), which will generate the SVG file of our functions call and open it in browser. or you can just generate svg file in current directory by typing svg command.
You can also do the same for your gin web server using this library : gin-contrib/pprof: gin pprof middleware (github.com)
Sample graph generated with above library(for sample gin application for login/signup).
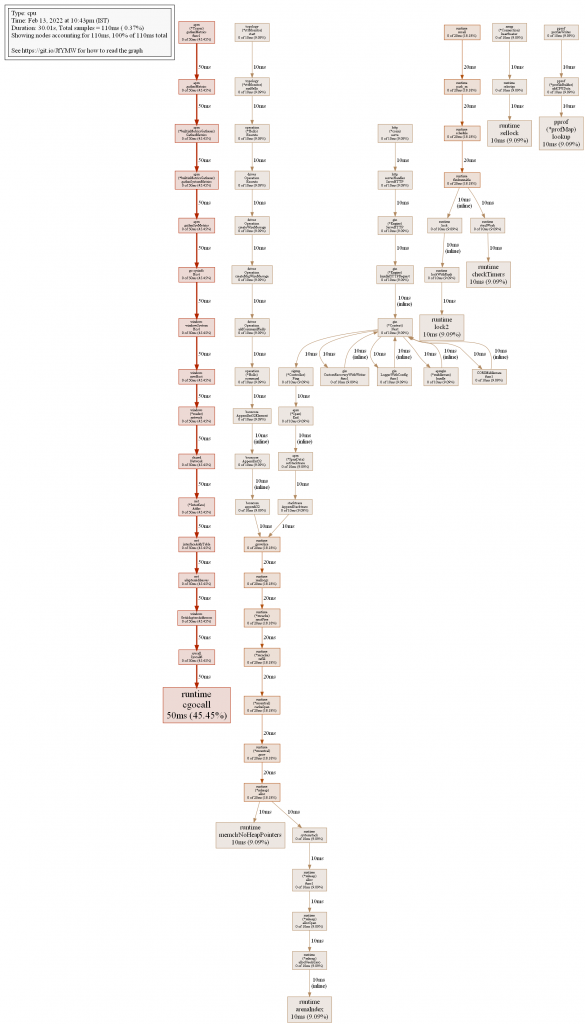
I have exported these images in png for displaying on web(you can also export this in svg, png or even pdf).
Thanks for reading…